Topology map: switches, hosts and power, drawn
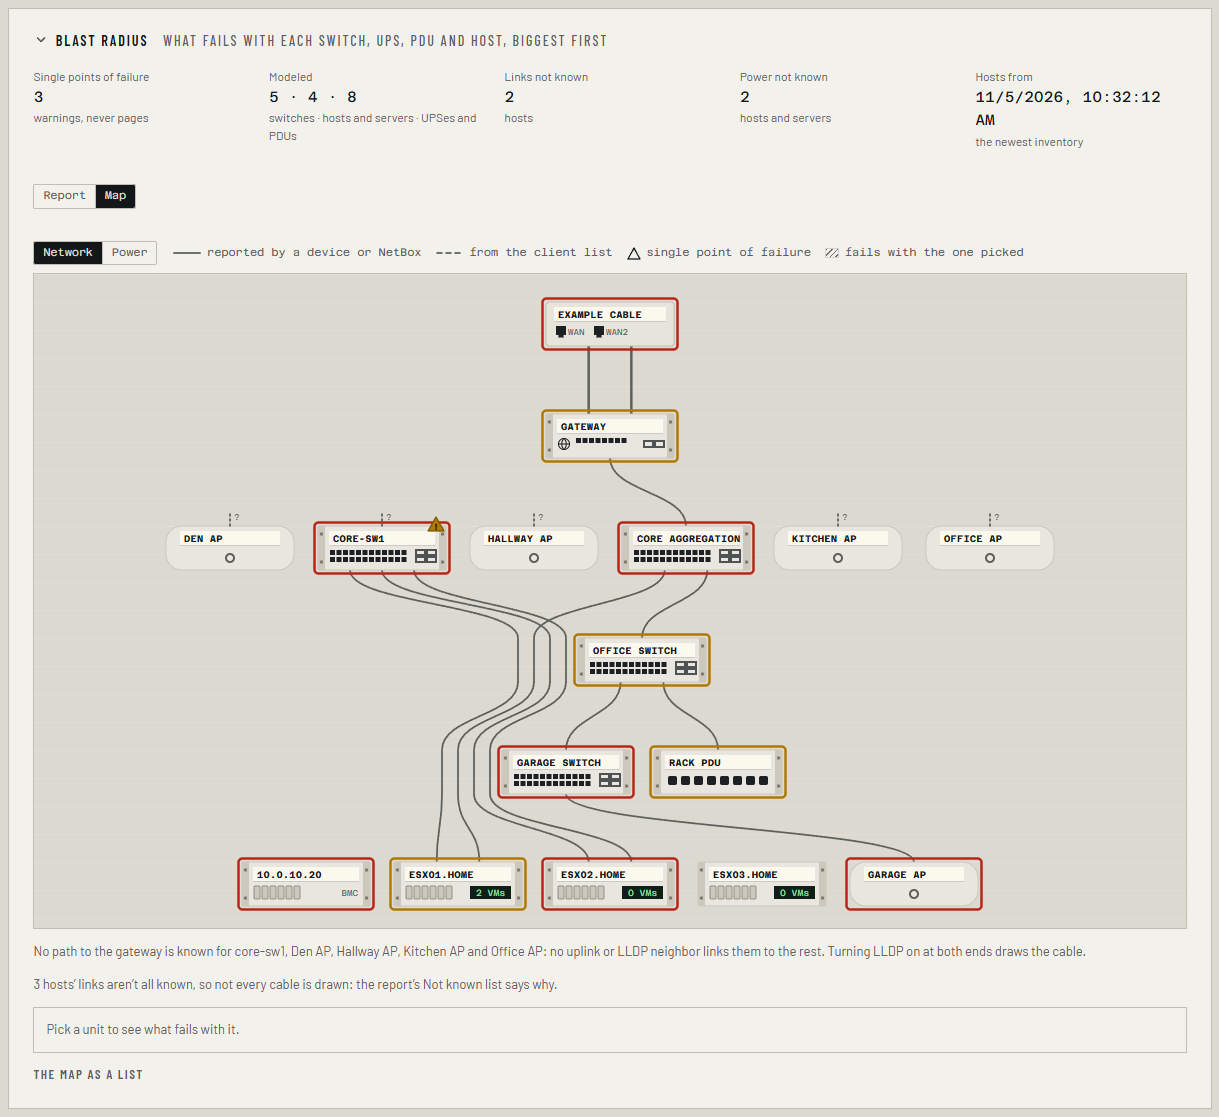
The Map view on the Resilience tab draws what Collimo knows about how your site hangs together: the internet line, the gateway, the switches under it, the hosts and servers plugged into them, and the UPSes and PDUs that feed them. Each unit carries its health, so you can see at a glance where a problem sits and what hangs off it.
The map is part of Business and MSP. It is drawn from what Collimo already reads, the same picture the blast-radius report uses (Resilience). Collimo only reads: nothing on the map changes a cable, a port or a setting.
Open it
- Open the Resilience tab.
- Under the figures at the top, choose Map (choose Report to go back). Your browser remembers which you picked.
- Choose Network or Power.
If the tab isn't there, see Resilience → Before you start.
Read the network map
From top to bottom:
- The internet, with one cable per WAN link. A link that is down has a break in its cable.
- The gateway.
- Switches and access points, one row per hop from the gateway.
- Hosts, servers and end devices, in one row. Each host's small green screen shows how many VMs run on it now.
Each unit is drawn as a small piece of equipment with its name on label tape: a switch with its ports, a host with its drive bays, a UPS with its battery, an access point as a puck.
| What you see | What it means |
|---|---|
| Solid cable | A device or NetBox reported it: the controller, LLDP, a switch's MAC table. |
| Dashed cable | Learned from the controller's client list (where it last saw the host's addresses), or set by hand. Worth checking. |
| Red or amber outline | The unit has an alert you haven't marked seen. |
| Triangle | A single point of failure: something depends on this unit alone. Amber until you mark the warning seen. |
| Dashed outline | A UPS or PDU that only NetBox or Settings names: Collimo doesn't read it. |
| Dotted stub with ? | No path to the gateway is known for this part of the network. |
Why some units have no cable to the gateway
Collimo only draws a cable it has been told about. A switch read over SNMP joins the drawing when LLDP is on at both ends of its uplink. Until then it sits beside the gateway's switches with a ? stub, rather than on a guessed cable.
Read the power map
The UPSes and PDUs that nothing feeds are at the top, any PDU fed through a UPS under them, and what they feed at the bottom. Each power supply is its own cable, so a server with two supplies on one UPS shows two cables to the same UPS.
Hosts and servers whose power isn't known aren't drawn: a note under the map counts them. To add them, cable their power ports in NetBox, or set what feeds them on the report's Not known list.
Pick a unit
Click (or tab to and press Enter on) any unit:
- what fails with it is hatched, and everything else fades;
- under the map: the sentence from the report ("If core-sw1 fails, esx02.home loses both links."), its alerts, every cable with its ports and where Collimo learned it, and a link to its own row on the LAN, Virtualization or Power and servers tab.
Click it again, or Clear, to go back.
On a phone
The map scrolls sideways inside its box and starts at the gateway. Under it, The map as a list has the same units row by row, with what each plugs into; it opens by itself on a narrow screen.
Large sites
Past 150 units, access points and devices with nothing behind them are drawn as one stack under their switch, with their count. Pick the stack to see who is in it.
What isn't on the map
- NAS and Ceph storage: Collimo can't yet tie a datastore to the NAS that serves it without guessing, so storage isn't drawn.
- On the hub: a site's map is on the site's own dashboard, not on the hub's view of it.
API
GET /api/resilience/map: the dependency graph's nodes and edges in a
stable order, each node's alerts, the single points of failure on the
switch, UPS or PDU they hang on, and what fails with each failure point,
as the last poll built it.