Network capacity
A link between two switches, or to the internet, gets busier slowly, over months, and most sites find out when everything behind it feels slow on a Monday morning. A switch's PoE budget runs out the day one more camera is plugged in and stays dark. Network capacity watches both and warns while there is time to plan:
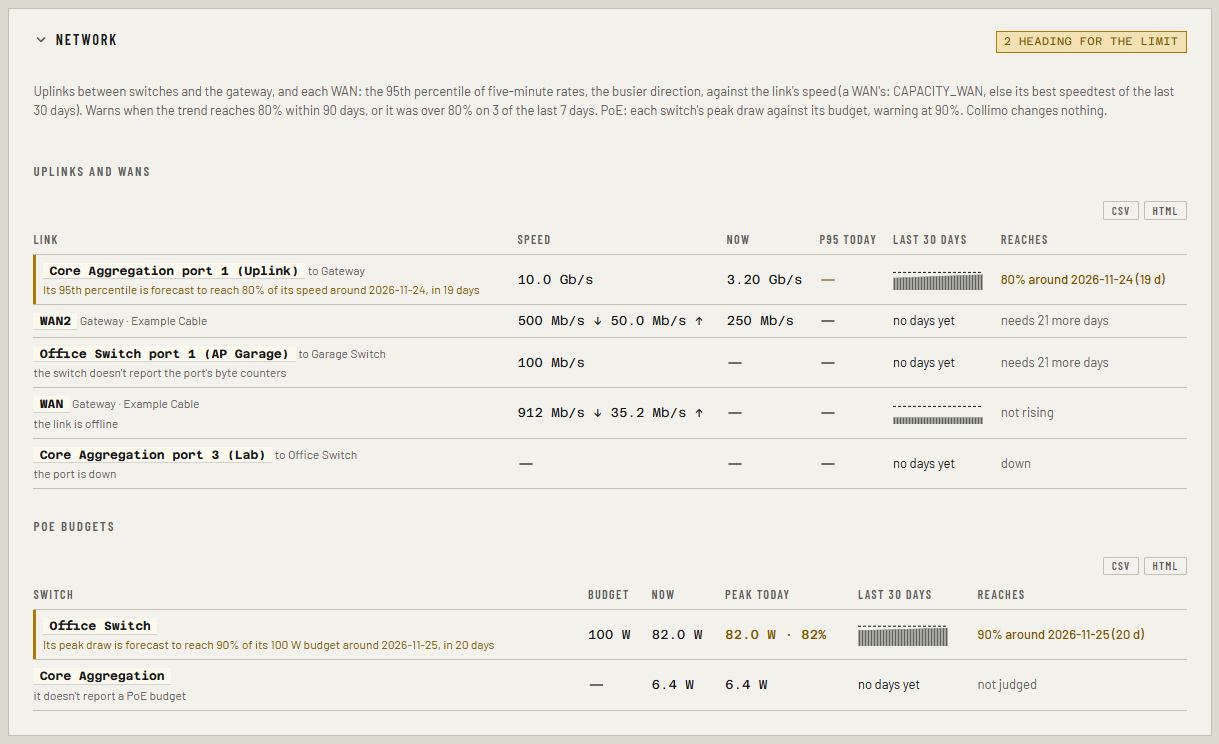
Core Aggregation port 1 (Uplink) to Gateway: 95th percentile today 68% of 10 Gb/s; reaches 80% around 2026-11-24 (21 d).
It warns when:
- an uplink's or WAN's 95th percentile is forecast to reach 80% of its speed within 90 days, or it was over 80% on 3 of the last 7 days;
- a switch's peak PoE draw is forecast to reach 90% of its budget within 90 days, or is over 90% already.
These are warnings, never critical: a link is upgraded and a switch replaced on a plan. Network capacity is part of Business and MSP. Collimo only reads: it never changes a port, a link or a PoE setting.
Before you start
- Your switches. UniFi switches and gateways through the console (see UniFi), and any other switch over SNMP (see Switches over SNMP).
- For each WAN, what it is meant to carry. Collimo uses the best
speedtest of the last 30 days that the gateway ran. If your gateway
doesn't run speedtests, or you'd rather judge against what you pay
for, set it: Settings → Stack environment,
CAPACITY_WAN, such asWAN=1000/40,WAN2=300/30(download/upload in Mb/s, by the WAN's name on the gateway). A WAN with neither is shown and not judged. - Three weeks. Each day's figure is kept when the day ends; a trend needs 21 days. Until then a link says needs 12 more days. The "3 of the last 7 days" rule works from the third day. Figures are kept on every edition, so a license added later starts with the history there.
- The archive kept between restarts (
LEDGER_PATH, on by default). With it off, history starts again at every restart.
Read it
Open the Capacity tab. The Network section has two tables:
Uplinks and WANs: each link between switches and the gateway, and each WAN, with
- its speed (a WAN's download and upload, and where they came from);
- now: the rate at the last poll, the busier direction;
- p95 today: the day so far, as a share of its speed;
- last 30 days: each day's 95th percentile as a bar, under a dashed line at 80%;
- reaches: when the trend reaches 80%, if it is rising.
PoE budgets: each switch that powers devices, with its budget, its draw now, today's peak, the last 30 days against 90%, and when it gets there.
A row is amber while its warning is new, until you mark it seen in Needs attention. A row that can't be judged says why: the port is down, it doesn't report a PoE budget, and so on.
Why the 95th percentile, not the average
An average hides the busy hours: a link at 20% all night and 90% every afternoon averages well under half. The 95th percentile of five-minute rates is what the link carried in all but its busiest 72 minutes of the day, which is what users feel. It is also how carriers bill burstable links.
Which links are watched
Only links between switches and the gateway, never access ports to computers, which would be too many to read:
- a port the controller marks as the switch's uplink;
- the port another switch or the gateway says it is plugged into, when that switch marks no uplink of its own;
- a port whose LLDP neighbor is another switch or the gateway that Collimo reads;
- each WAN.
Access points, PDUs and the cable modem are left out. A link seen from both ends over LLDP is listed from both switches.
When it warns
An uplink:
- Check what is busy. In the controller, or on the switch, look at which ports behind the link carry the traffic.
- Plan more capacity: a faster link (10G instead of 1G), a second link aggregated with the first, or moving the busy hosts onto the same switch as what they talk to.
A WAN:
- Compare with what you pay for. If the warning is against a
speedtest, run one at a quiet hour; set
CAPACITY_WANto the plan's figures if the speedtests are low. - Talk to the provider about a faster plan, or share the load with a second WAN.
A PoE budget:
- Check what draws the most on the switch's ports, in the controller.
- Plan: move a device to another PoE switch, add a PoE injector, or replace the switch with one with a larger budget, before the next camera or access point is added.
The warning clears by itself once the trend or the draw falls well back.
How the figures are worked out
- Every poll, each link's byte counters are read and the difference since the last poll gives a rate. A counter that resets (a switch reboot) gives nothing for that poll; an old 32-bit counter that wraps is counted through; a gap of more than ten minutes between readings isn't spread over; a rate faster than the port can carry is a glitch and dropped.
- Rates fold into five-minute buckets. At midnight each direction's 95th percentile is kept, if the day had at least three hours of buckets, and the busier direction is the day's figure.
- PoE: the switch's ports' draw is summed at every poll, and the day's
peak is kept, against the budget the switch reports
(
total_max_poweron UniFi switches). Switches from other makers over SNMP aren't read for PoE yet. - Days are kept in the capacity history beside the archive, for two years. The day so far survives a restart, except the five minutes in progress.
- The trend is the one capacity planning uses (see How forecasts work), over the last 90 days, with the busiest weekday on top. A link whose speed changes starts its trend again: a 1G link upgraded to 10G isn't heading anywhere.
Alerts and metrics
| Alert | When | Level |
|---|---|---|
Uplink or WAN heading for saturation (link_saturation) |
p95 forecast at 80% within 90 days, or over 80% on 3 of the last 7 days | warning |
PoE budget running out (poe_budget) |
peak draw forecast at 90% of the budget within 90 days, or over 90% now | warning |
infra_link_p95_ratio{device, port} is a link's 95th percentile on the
latest day kept, over its speed (a WAN's port is its name, such as
WAN2). infra_poe_budget_used_ratio{device} is a switch's peak PoE draw
on the latest day kept, over its budget. Both are absent until a day has
been kept.